Bearish for crypto
Market briefing: Bitcoin trades at $58,988, down 3.6% on the day after the fragile $60,000 floor cracked. Near $1 billion in two-day ETF outflows points to institutions, not retail, doing the selling.
- Bitcoin slipped below $59,000 and now trades at $58,988, down 3.65% in 24 hours.
- Spot Bitcoin ETFs posted two straight days of near-$1 billion combined outflows, including a $469 million print.
- The selling looks institutional, not retail, which shapes where the next support really sits.
Bitcoin's fragile floor just cracked under heavy ETF outflows, with price below $59,000. Is this the institutional capitulation smart money has been waiting for?
Bitcoin lost its grip on $60,000. Price slid from the low $60,000s, dipped below $62,000, then briefly broke under $59,000. It now trades at $58,988, down 3.65% over the last 24 hours and still soft, off another 0.68% in the past hour. The driver is not mysterious. Spot Bitcoin ETFs posted two straight days of near-$1 billion combined outflows. One session alone saw $469 million leave. Capital keeps draining from crypto exchange-traded funds while it flows into other risk assets. That is the whole story behind the crack. When ETFs bleed, market makers must sell the underlying Bitcoin to balance their books. That selling lands directly on the order book. The $60,000 floor was always thinner than it looked. It held on hope, not on fresh demand. Once the outflows stacked up, the level had nothing underneath it. What changed structurally is who is in control. This is not panicked retail dumping coins. Retail has largely stepped back from daily trading. The pressure is coming from institutions reducing exposure through the ETF wrapper. That distinction matters for everyone watching the chart. A floor that breaks on institutional selling behaves differently from one that breaks on retail fear. It tells you supply is being released by larger, slower hands. And it tells you where the real demand might be waiting to absorb it. That is the question this break forces every trader to answer.
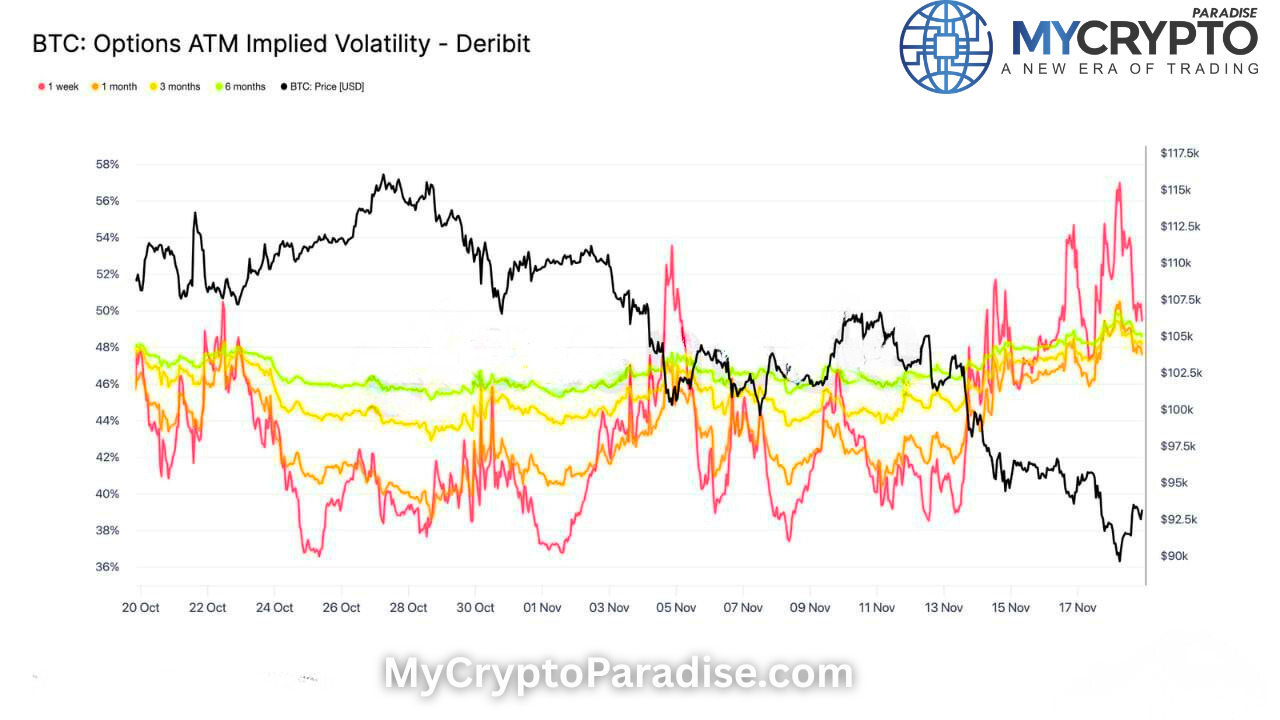
How ETF outflows drain Bitcoin liquidity
The transmission runs straight from the fund flows to the spot price. Spot Bitcoin ETFs hold real coins. When investors redeem shares, the issuer must sell Bitcoin to meet the withdrawal. Two days of near-$1 billion outflows means a steady stream of forced selling hitting the market. That is the mechanism behind the $60,000 break. Now layer in the macro backdrop. A hawkish Federal Reserve keeps pressure on every risk asset. Higher-for-longer rates raise the cost of holding things that pay no yield. Bitcoin sits at the top of that list. Money managers trim the riskiest sleeve first, and crypto qualifies. The divergence makes it sharper. AI stocks and other risk-on names have rallied while Bitcoin lags. Capital is rotating, not disappearing. It is leaving the ETF wrapper and finding homes that feel safer or trendier right now. That rotation drains the liquidity that defended $60,000. Thin liquidity is why a level cracks cleanly instead of grinding. Fewer resting bids mean each sell order pushes price further. The $469 million outflow did not need to be enormous to matter. It only needed to arrive into a shallow book. This is why the floor felt fragile long before it broke. The structure was hollow underneath. Outflows plus a risk-off macro tone plus thin demand is a recipe for an air pocket, and Bitcoin just fell through one.
Why Bitcoin leads the broader crypto slide
Bitcoin sets the tone, and right now the tone is heavy. The break under $59,000 removes the psychological comfort of a round-number floor. Traders who anchored to $60,000 are now offside. Their stops sit just below recent lows, and that is fuel for further downside if momentum continues. Where Bitcoin goes, the rest of the market follows with a delay and a multiplier. Ethereum tends to track Bitcoin's direction but moves harder in both directions. A clean break in Bitcoin usually drags ETH down faster on a percentage basis. The same outflow-driven liquidity squeeze that hit Bitcoin spreads through correlation, not through ETH-specific news. Altcoins sit at the far end of the chain. They are the highest-beta expression of crypto risk. When Bitcoin liquidity thins and the leader cracks, alts get sold first and bought back last. Thin books there mean sharper wicks and faster drawdowns. This is the classic liquidity cascade: institutional ETF selling hits Bitcoin, correlation carries it to Ethereum, and leverage amplifies it across alts. Retail is largely absent from daily trading, which removes a layer of dip-buying that might otherwise cushion the move. With fewer eager buyers stepping in, the path of least resistance points down until larger spot demand appears. That is the structural reality of this break. The cascade is institution-led, and the floor under each tier is only as solid as the next bid waiting beneath it.
Signals that confirm or stall the breakdown
The next clue lives in the ETF flow data. If outflows keep printing near $1 billion per day, the selling pressure stays mechanical and the breakdown likely extends. A flip back to inflows would be the first sign the forced selling is easing. Watch the daily numbers, not the headlines. Price behavior around the broken floor matters next. A failed retest of $60,000 from below, where price taps the level and rejects, would confirm sellers now defend it as resistance. That flips old support into a ceiling. If instead Bitcoin reclaims $60,000 and holds, the break looks like a shakeout rather than a trend change. Volume is the tell. A flush on rising spot selling volume confirms institutions are still distributing. A bounce on thin volume is weak and usually fades. We want to see whether buyers show conviction or simply absence of sellers. The macro calendar is the wildcard. Any softening in the Fed's tone could relieve pressure across risk assets and put a floor under crypto. A doubling-down on hawkishness does the opposite. Finally, watch where retail stays. With participation already at multi-year lows, a sudden surge of retail dip-buying into this break would be a warning, not a comfort. Lasting bottoms tend to form when larger spot hands quietly accumulate, not when the crowd rushes in. Until that demand appears, the breakdown holds the benefit of the doubt.
What this break signals for where demand waits
Here is how the ParadiseTeam reads it at $58,988. This break is bearish in the near term, and we treat it that way. The $60,000 floor cracked on institutional selling, not retail panic, which tells us supply is still being released by larger hands. That supply needs a buyer, and the buyer is not here yet. Our macro reaccumulation zone sits lower, between $55,000 and $44,000. Current price has not reached it. That gap is the warning: we are between a broken floor and the area where real demand likely waits. We are not buying into the air pocket. We are watching for a relief bounce. A push back toward $73,000 near a major moving average, or $79,000 around the CME gap and the 786 retracement, would be a swing-short region, not a place to chase longs. Those levels are where trapped buyers and late institutions might try to exit. The crowd is largely gone, with investor counts at six-year lows, so this is an institution-led flush, not a retail one. The signal we want before calling a bottom is specific: sustained institutional frustration in the flow data paired with higher highs on spot accumulation volume inside the $55,000 to $44,000 zone. Until that confluence prints, the path stays heavy. Probabilities, not promises. This is our read on positioning, not advice, and the break under $59,000 keeps the cautious bias intact.
For exact entries, targets, and stop losses with full risk management, that is what ParadiseFamilyVIP is for. New to reading these moves? Start with our crypto trading strategies guide.
ParadiseTeam is monitoring the market situation closely, and we are taking these developments into consideration while building our trading tactics inside ParadiseFamilyVIP.
Crypto trading involves substantial risk. Prices are volatile and you can lose money. This article is educational and is not financial advice. Past performance does not guarantee future results.