Developing story update (June 28, 2026, 21:25 UTC):
Update: Bitcoin has now printed its lowest level since September 2024 after slipping under $60,000, and it is trading below all five of its key daily moving averages, a strong bearish technical posture. This confirms, rather than changes, the pressure we flagged.
For traders, the level to watch flips to the upside: tactical resistance now sits between $60,750 and $61,000. A reclaim of that band would be the first real sign bears are losing the grip, while failure there keeps the short-term trend heavy. As always, treat these as probabilities, not certainties, and size accordingly.
What to watch now: A daily close back above the $60,750 to $61,000 resistance band as the first sign of a shift.
Listen: the 2-minute breakdown
Market briefing: Bitcoin trades near $59,606, roughly half its $126K peak, and the $60,000 line is now the whole story. Bears own the indicators, but the order flow under the surface is starting to disagree with them.
- Bitcoin sits near $59,606, about 50% below its $126,000 all-time high
- Technical indicators read 29 bearish against just 3 bullish, yet price keeps reclaiming $60,000
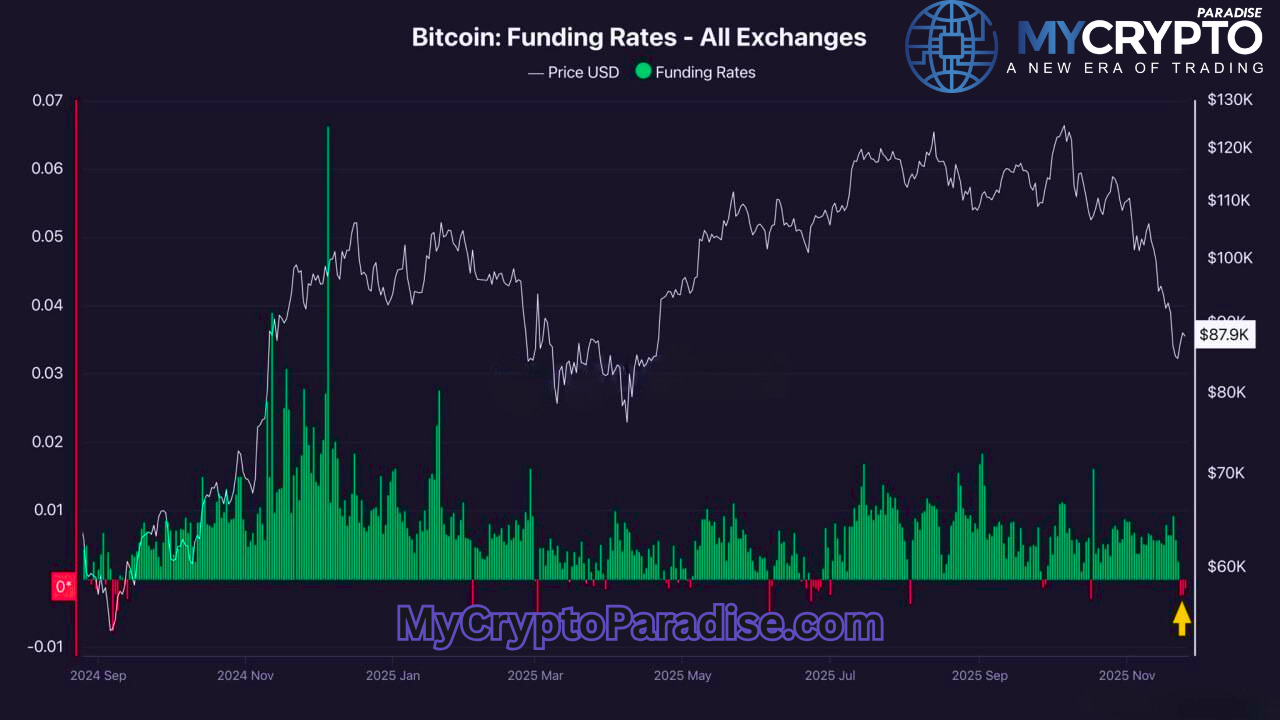
- An inexperienced whale is heavily short, leaving fuel for a squeeze if support holds
Bitcoin is trading near $60,000, half its $126K peak, and the indicators scream bearish while price refuses to break. So who is really selling, and who is quietly buying?
Bitcoin is changing hands near $59,606, more than 50% below the $126,000 high it printed in 2025. That places this cycle squarely in one of its deeper corrective phases. The headlines call it a battleground, and for once the cliche fits. Four bullish forces and four bearish ones are pulling on the same price, and none of them has landed a clean blow.
The bearish case is easy to see. Of the indicators we track, twenty-nine read bearish and only three read bullish. Sentiment across most measures leans negative. Michael Saylor's stock has absorbed an 82% drawdown, which is one way to underperform the very asset it was built to hold. Retail has watched its conviction drain out one red candle at a time.
The bullish case is quieter, which is usually the point. Bitcoin tested $60,000, wobbled, and bounced. Institutional buyers, corporates and a handful of nation states keep treating weakness as inventory rather than warning. There is no single confirmed catalyst behind this week's move, and we will be honest about that. What there is, structurally, is a market that keeps being offered lower prices and keeps refusing to stay there. That is not yet a reversal. But it is the kind of stubborn floor that tends to precede one, and it is why the $60,000 line matters far more than the mood around it.
Why no single catalyst explains this drop
There is no clean news event driving Bitcoin to $60,000 this week, and pretending otherwise would be dishonest. This is our interpretation, not a confirmed cause. The move is the sum of an extended corrective phase meeting tired sellers.
That matters because of how liquidity behaves at the end of a long drawdown. When a market falls 50% from its high, the marginal seller changes. Early sellers were taking profit. The sellers down here are mostly forced or frightened. Their supply is finite. Once it clears, price stops needing a reason to fall, and the absence of a reason starts to work the other way.
Macro sits underneath all of it. Spot ETFs, corporate treasuries and sovereign buyers have built durable demand that does not flinch at a red week. El Salvador keeps buying. Talk of a US strategic reserve refuses to die. None of that is a same-day catalyst. All of it is a slow bid that thickens as price falls.
The transmission is simple. Patient capital accumulates while leveraged capital capitulates. The screen looks bearish because indicators measure the recent past. The order book tells a different story about the recent future. When confirmed demand absorbs frightened supply at support, the conditions for a turn are being built quietly, well before any indicator agrees.
How $60K decides BTC, ETH and alts
Everything routes through the $60,000 level first. Bitcoin leads, and right now Bitcoin is coiled rather than trending. A daily close back above $60,000 would change the liquidity picture across the whole market.
Start with the stops. After a 50% drawdown, short positioning has crowded in, betting the floor breaks. That includes a notably inexperienced whale carrying a heavy short with liquidation risk up toward $65,836. Crowded shorts are simply buy orders waiting to be triggered. If Bitcoin reclaims and holds above $60,000, those orders feed a squeeze rather than a fall.
Ethereum sits one step down the risk ladder. ETH has had its own week of whale selling and dormant wallets waking up, which we covered separately. A confirmed Bitcoin turn would let that supply get absorbed instead of compounding. ETH typically lags Bitcoin off a bottom by a session or two, then catches up fast.
Alts sit at the end of the chain and feel it last. They bleed hardest in fear and rip hardest in relief, because their liquidity is thin in both directions. None of this moves without Bitcoin moving first. So the cascade is not four separate stories. It is one decision at $60,000, transmitted outward through progressively thinner books, hitting the riskiest assets last and loudest.
The daily close that confirms a turn
The cleanest signal is a daily candle that closes green and above $60,000. That is the difference between a wick that grabs liquidity and a structural reclaim. Below it, this is still just a test of support.
Layer in confirmation. A close above the $60,300 region adds weight, since it reclaims a level the market has been rejecting. Volume on that candle should sit above the recent average, because a turn on thin volume is usually a trap dressed as a triumph. Momentum should agree too: a reclaim on MACD and a bullish cross on stochastic RSI would tell us buyers, not short covering alone, are doing the work.
The most encouraging tell is already forming. Price keeps making lower lows while volume and RSI make higher lows. That bullish divergence says sellers are pushing with less force each time. Bears losing power is not the same as bulls winning, but it is how bottoms begin.
Invalidation keeps us honest. A decisive daily close back below $58,000, where bulls are currently defending, weakens the case. Losing $54,000 would open the next important support zone lower and tell us the absorption failed. Probabilities, not promises. The structure leans constructive, but it is the $60,000 close, on real volume, that turns a hopeful read into a confirmed one.
Reading the $60K fight through smart money
The ParadiseTeam reads this as a test of support, not a breakdown, with the tape and the indicators telling opposite stories. At $59,606, Bitcoin sits inside the zone where this decision gets made.
Apply that to the levels. The line that matters is a daily close above $60,000, ideally clearing $60,300, on volume above the average. That is what would flip the structure from defense to offense. Beneath it, $58,000 is where bulls are holding the floor, and $54,000 is the next support if that floor gives way. To the upside, $65,836 is not just resistance. It is roughly where the heavily short whale faces liquidation.
That detail is the whole edge here. Retail and an inexperienced whale are leaning short into long-tested support while smart money absorbs the supply. Previous lows looked like long squeezes, not genuine spot selling, which means the panic was leveraged, not structural. The bullish divergence in volume and RSI fits that picture: bears are running out of force.
So the stops now sit above the market, not below it. That inverts who is trapped. If support holds and $60,000 is reclaimed, the path of least resistance points toward those shorts. This is a read on probabilities and structure, never a guarantee, and the $60,000 close is the line that confirms or invalidates all of it.
For exact entries, targets, and stop losses with full risk management, that is what ParadiseFamilyVIP is for. New to reading these moves? Start with our crypto trading strategies guide.
ParadiseTeam is monitoring the market situation closely, and we are taking these developments into consideration while building our trading tactics inside ParadiseFamilyVIP.
Crypto trading involves substantial risk. Prices are volatile and you can lose money. This article is educational and is not financial advice. Past performance does not guarantee future results.