Developing story update (June 27, 2026, 05:27 UTC):
The flush has gone deeper since we published. Bitcoin extended its slide to as low as $58,000, its weakest level in 21 months, in what is now the third break below $60,000 this year.
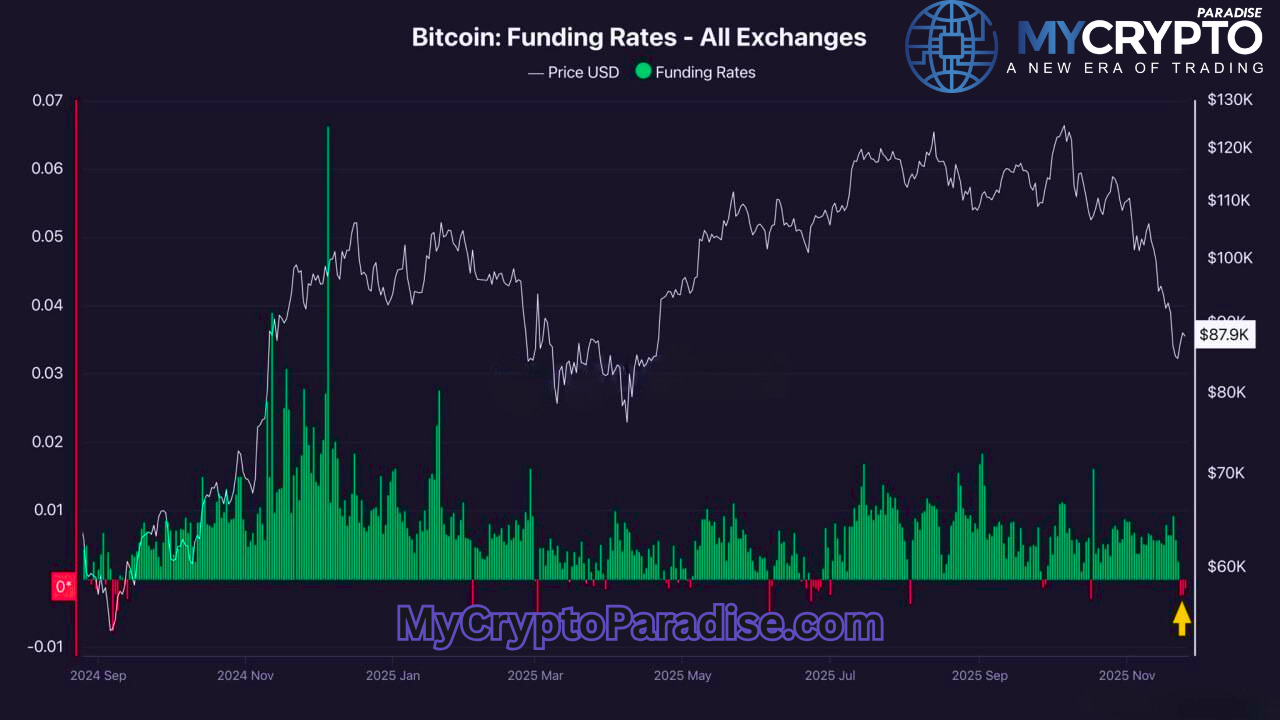
The pressure was not only leverage. Spot ETF outflows reached $469 million in a single day, the largest single-day exit this month, pointing to institutional selling on top of the cascade. At one point nearly $600 million in positions were liquidated within a single hour.
This keeps our read intact: a deleveraging phase where weak hands are flushed first. It likely takes more pain before smart money commits, with the $55,000 to $44,000 zone still the area we are watching for aggressive reaccumulation.
What to watch now: Whether ETF outflows continue tomorrow, which would signal sustained institutional selling rather than a one-day exit.
Listen: the 2-minute breakdown
Market briefing: Bitcoin has fallen below 60,000, trading near 59,887, as more than a billion dollars in leveraged positions were wiped out across crypto. The trigger sits outside crypto: warnings of an AI bubble are pulling capital out of risk everywhere.
- Bitcoin fell below 60,000, a 53% drop from its late 2025 peak and its lowest in nearly two years.
- More than a billion dollars in positions were liquidated, including 588 million in Ethereum and over 97% of XRP longs.
- Global stocks fell hard, with the Kospi down 5.8% and the Nikkei down 4.2% on AI bubble fears.
Bitcoin dropped below 60,000 as liquidations passed 1 billion in a single brutal session. The trigger was not even crypto. So what actually broke?
Bitcoin fell below 60,000. It now trades near 59,887, its lowest level in almost two years, and roughly 53% beneath its late 2025 peak. In one session, more than a billion dollars in leveraged positions were liquidated across the crypto market. Ethereum took a 588 million dollar flush and now sits near 1,578. The damage in XRP was almost total: over 97% of long positions were liquidated in twenty four hours. That is not a correction. That is a clear out. The interesting part is where the pressure came from. It did not start in crypto at all. Global shares sank in the same window. South Korea's Kospi fell 5.8%. Japan's Nikkei shed 4.2%. The story behind both is the same one repeating in every asset class: fear that the artificial intelligence boom has become a bubble. Two prominent hedge fund managers warned exactly that, and tech weakness on AI spending fears did the rest. When the riskiest corner of equities wobbles, the riskiest corner of everything follows. Crypto is downstream of that. There is no single confirmed crypto catalyst here, and we will not pretend there is. This is risk-off contagion, and leverage simply amplified it. Forced sellers met thin liquidity, and the cascade did the talking. The number of crypto investors sits near a six year low, so the people left holding the bag were mostly the leveraged ones who always swear this time is different.
How an AI bubble scare reached crypto
The transmission mechanism matters more than the headline number. This selloff began in equities, not in any token. When two well known hedge fund managers call the AI boom an unsustainable bubble, large allocators do not sell only AI stocks. They cut risk broadly. Tech weakness driven by AI cost and demand worries dragged the major indexes lower. The Kospi and Nikkei falls confirm this is global, not local. Crypto sits at the far end of the risk spectrum. It is the first thing sold when the mood turns and the last thing bought when it recovers. So macro risk-off becomes a liquidity shock. Capital rotates out of speculative assets, and crypto wears it twice: once from selling, once from the leverage stacked on top. That leverage is the multiplier. A modest price drop forces margin calls. Those calls become market sells. Those sells push price lower, triggering the next layer of calls. A billion dollars in liquidations is what that loop looks like in numbers. None of this requires a crypto specific scandal. It only requires fear somewhere upstream and too many borrowed positions downstream. That is the honest read. The driver is the AI bubble scare and the risk-off it created. Everything that followed in Bitcoin, Ethereum and XRP is the second order effect of that single shift in sentiment, expressed through forced selling.
Liquidations cascade from Bitcoin to alts
Watch how the damage travelled. Bitcoin led the move down, breaking 60,000 and setting the tone for everything below it. Ethereum followed, absorbing a 588 million dollar liquidation and slipping to around 1,578. Then the smaller, higher beta names took the worst of it, with XRP losing more than 97% of its long positions. That is the standard order of a liquidity cascade: Bitcoin first, Ethereum second, alts last and hardest. The further out on the risk curve, the more violent the flush. But the tape was not uniform, and that detail matters. Aave rose roughly 17% during the same session, testing a nine month trendline while almost everything else bled. Relative strength like that, in the middle of a billion dollar washout, is a tell. It usually means real spot demand is sitting under that specific asset. Narrative also held a pulse: a fresh ultra bullish research report on Hyperliquid set a 319 dollar target by 2028. We note such targets without endorsing them, since multi year forecasts are confident far more often than they are correct. The broad picture is forced selling meeting thin liquidity. Weak hands and over leveraged players were flushed. Where you see green inside a red day, someone with patience is likely absorbing the supply that fear is handing them.
What confirms a bottom versus a bounce
From here, separate a real bottom from a relief bounce. The first thing to watch is whether the macro fear cools. This move was led by equities, so a stabilising Kospi and Nikkei and an easing AI bubble narrative would take pressure off crypto directly. If global risk-off deepens instead, expect more forced selling. The second thing is structure. A short term bounce is likely after a flush this size, because liquidations leave the field thin and reflexive. That bounce is not automatically the turn. We would treat strength back toward the 73,000 to 79,000 region as a place where sellers can return, not as confirmation that the low is in. The third and most important signal sits lower. The 55,000 to 44,000 zone is where we expect the real test. A genuine bottom would show two things together: a sustained stretch of institutional frustration, and higher highs on spot accumulation volume inside that zone. One without the other is noise. Invalidation of the bearish case would be Bitcoin reclaiming the higher region with strong, broad spot demand, not a thin leverage driven spike. For now, with price near 59,887 and above the accumulation zone, the burden of proof sits with the bulls. Confirmation lives in spot volume and a calmer macro tape, not in a fast green candle.
Why this flush sits above the accumulation zone
Here is how the ParadiseTeam reads this specific flush against price near 59,887. A billion dollar liquidation event fits a familiar pattern: leverage gets cleared, weak hands capitulate, and patient spot buyers absorb the supply. That is the smart money versus retail dynamic working in real time, and the Aave strength during the washout hints that selective accumulation is already happening somewhere. But context is everything. This flush is landing above our key reaccumulation zone of 55,000 to 44,000, not inside it. That distinction changes the read. We are not yet at the level where we expect aggressive spot reaccumulation to form a macro bottom. A short term bounce is plausible after a clear out this size, with the 73,000 to 79,000 region marking where prior structure and a CME gap sit. We view that area as where supply can re enter, not where the all clear sounds. The signal we actually want is confluence inside 55,000 to 44,000: an extended stretch of institutional frustration alongside higher highs on spot accumulation volume. Until those align, strength is more likely to be sold than chased. Retail tends to buy the bounce and call it the bottom. Probabilities, not certainty, guide this. The honest position is patience: respect the downside path while watching that lower zone for the real reaccumulation tell.
For exact entries, targets, and stop losses with full risk management, that is what ParadiseFamilyVIP is for. New to reading these moves? Start with our crypto trading strategies guide.
ParadiseTeam is monitoring the market situation closely, and we are taking these developments into consideration while building our trading tactics inside ParadiseFamilyVIP.
Crypto trading involves substantial risk. Prices are volatile and you can lose money. This article is educational and is not financial advice. Past performance does not guarantee future results.