In short
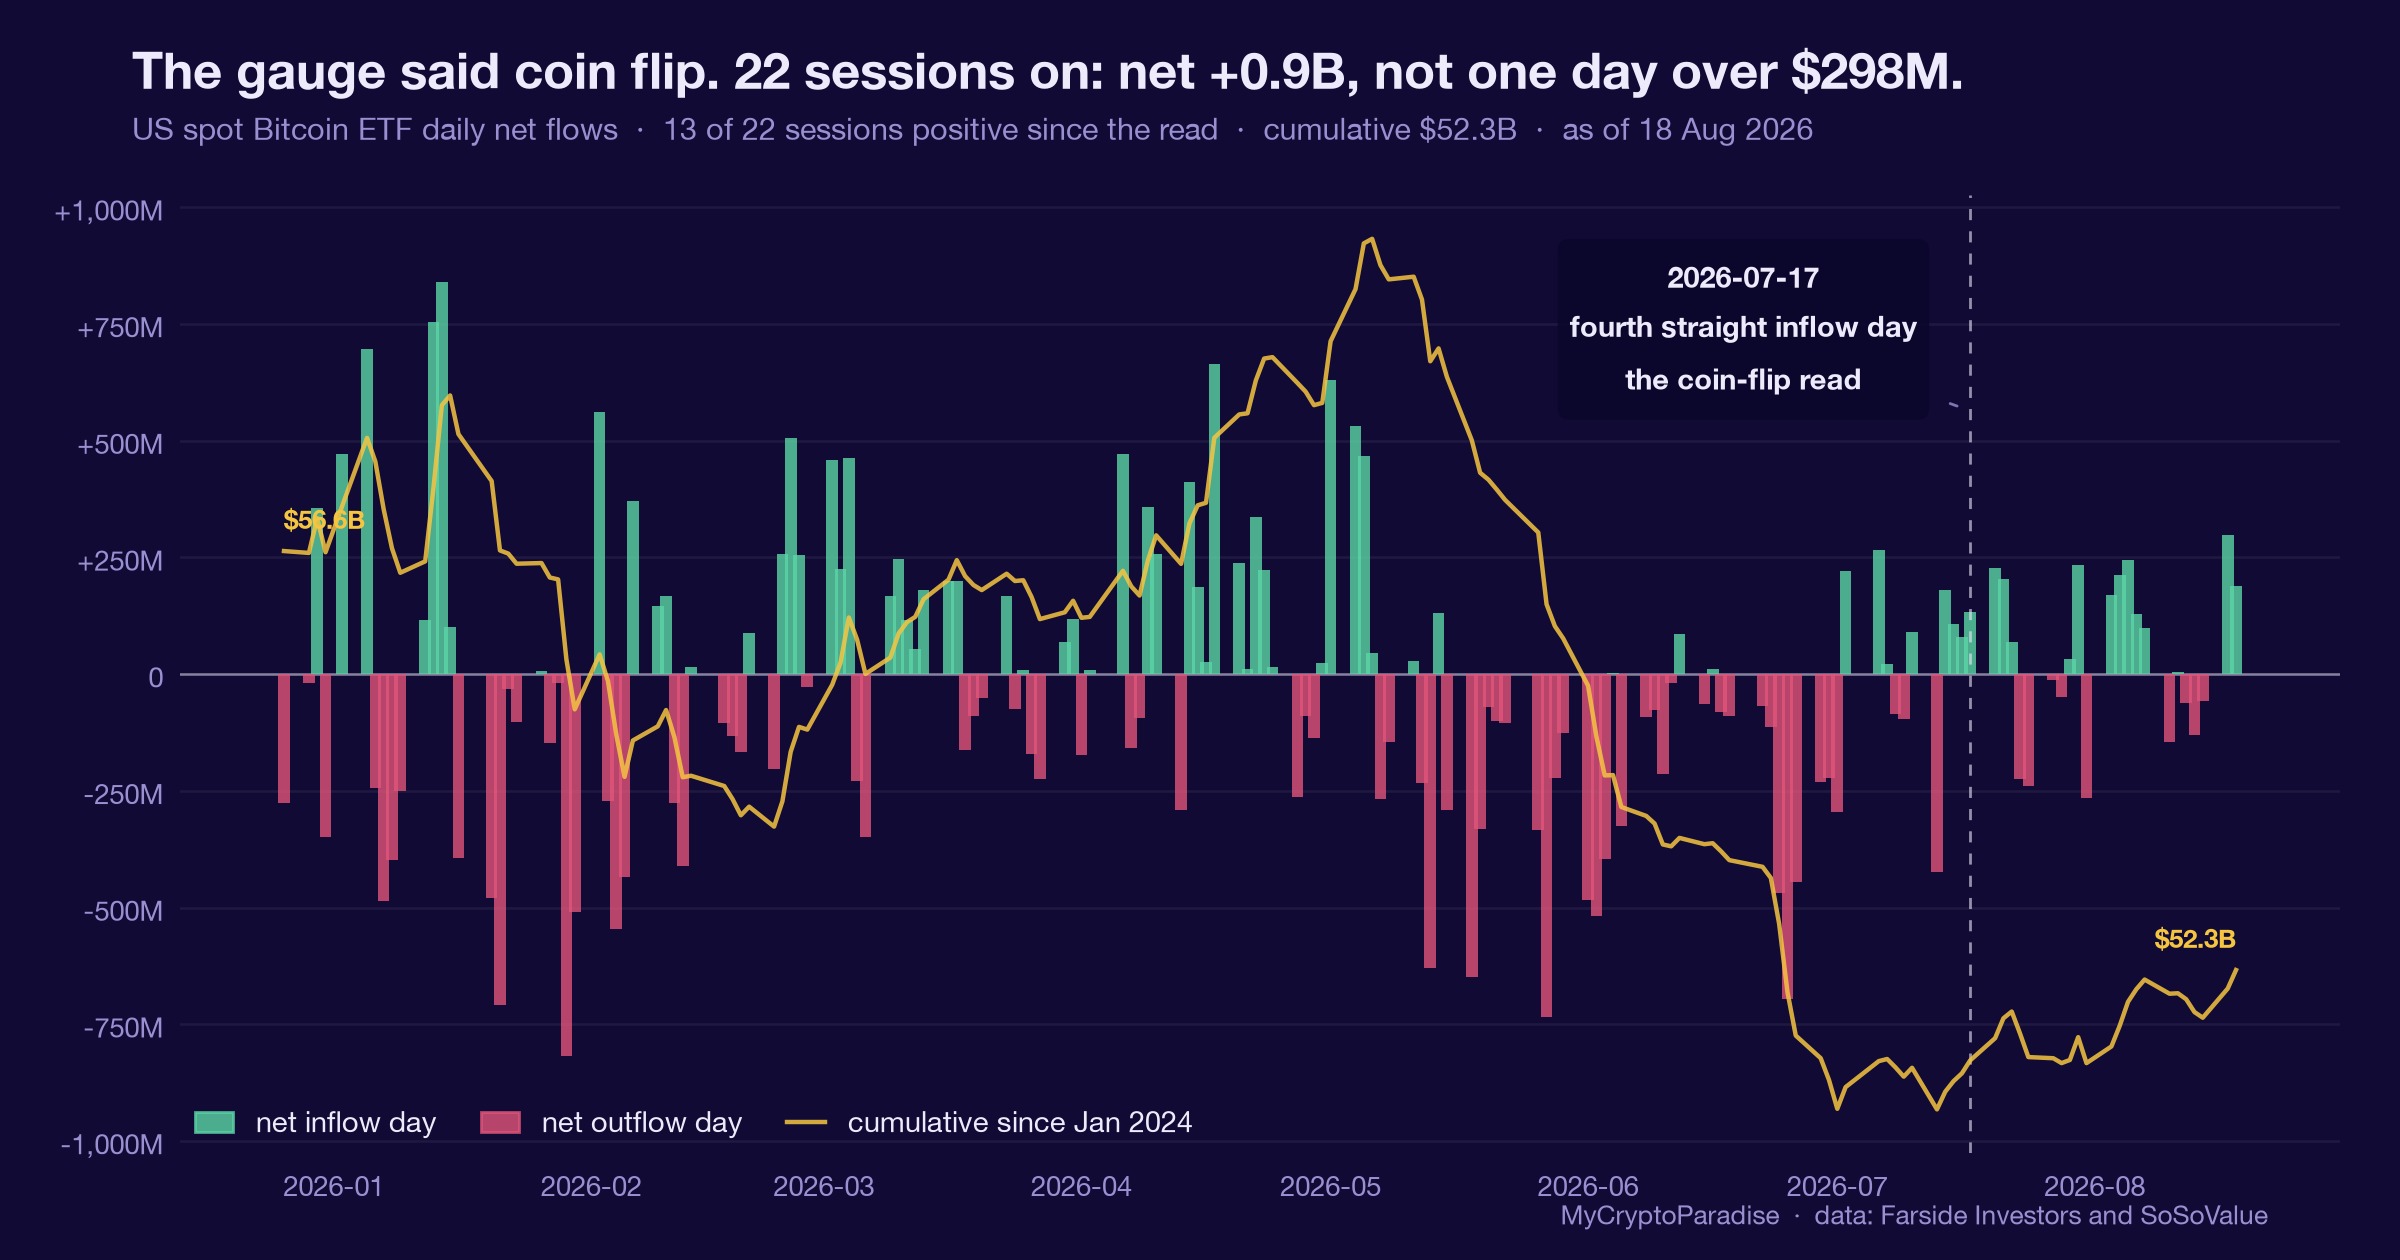
On 17 July 2026 US spot Bitcoin ETFs logged a fourth straight day of net buying, +$132.3M, and our ETF-tide grade read 51 out of 100. We published it as what it was: a coin flip. The same week a decade-scale thesis was making the rounds, comparing Bitcoin ETFs to gold’s 22-year arc, and we kept it separate from the ten-session picture because a multi-year adoption story says nothing testable about next week. The follow-through has graded the refusal well: in the 22 sessions since, the complex netted +$923M with 13 positive days and not a single day over $298M, and the tide grade has moved from 51 to 53. A quiet tide stayed quiet. This piece shows you how to read ETF flows without inventing conviction the data does not carry.
What the ETF tide actually measures
Every trading day, each US spot Bitcoin ETF publishes its net creations and redemptions. Add them up and you get the day’s net flow: real dollars entering or leaving the complex.
Our tide grade ranks the recent flow picture against its own history since April 2024 and asks one question: at readings like this, how often did price resolve higher?
The answer on 17 July was 11 of 22 effective prior cases. About 51%. That is a coin flip, and the grade said so.
A gauge that admits it has no edge is more useful than one that always finds a signal. Most days in most markets are exactly this.
The 17 July reading
The streak was real but modest: four straight positive days, +$132.3M on the day, cumulative flows at $51.4B since January 2024, per our MCP Insights ETF data sourced from Farside Investors and SoSoValue.
The five-day flow reading held positive at +75.7 and the tide impulse sat at 58. Money arriving steadily, without drama.
The wrinkle worth knowing: price was not cooperating. BTC sat roughly 0.4% lower over the trailing five sessions even as flows stayed green.
Our tide flags that pattern as allocator absorption. Net buying soaked up by soft spot rather than chased. It is a patience signal, not a momentum one.
What is different here
The ParadiseTeam publishes the distribution, not just the direction. When our own history says 11 of 22 comparable readings resolved higher, we write coin flip in the headline rather than dressing 51% as conviction. The gauge moving one point is the statistical equivalent of clearing its throat, and we say that too.
A decade thesis is not a weekly signal
The source note that day relayed Bloomberg Intelligence’s framing: gold ETFs grew from roughly $22B to $190B over 22 years, and Bitcoin ETFs sit in year two of a comparable curve. Those figures are Bloomberg’s, not ours.
The thesis may well be right. It is also untestable on any horizon a trader acts on.
Mixing time frames is how neutral tapes get traded as breakouts. A ten-session read and a ten-year story can both be true and still have nothing to say to each other.
Our rule: grade the horizon you can falsify. The next ten sessions have a distribution; the next decade has a narrative.
How the read has graded
Twenty-two sessions on, the tide has behaved exactly as a 51 suggested it might: quietly.
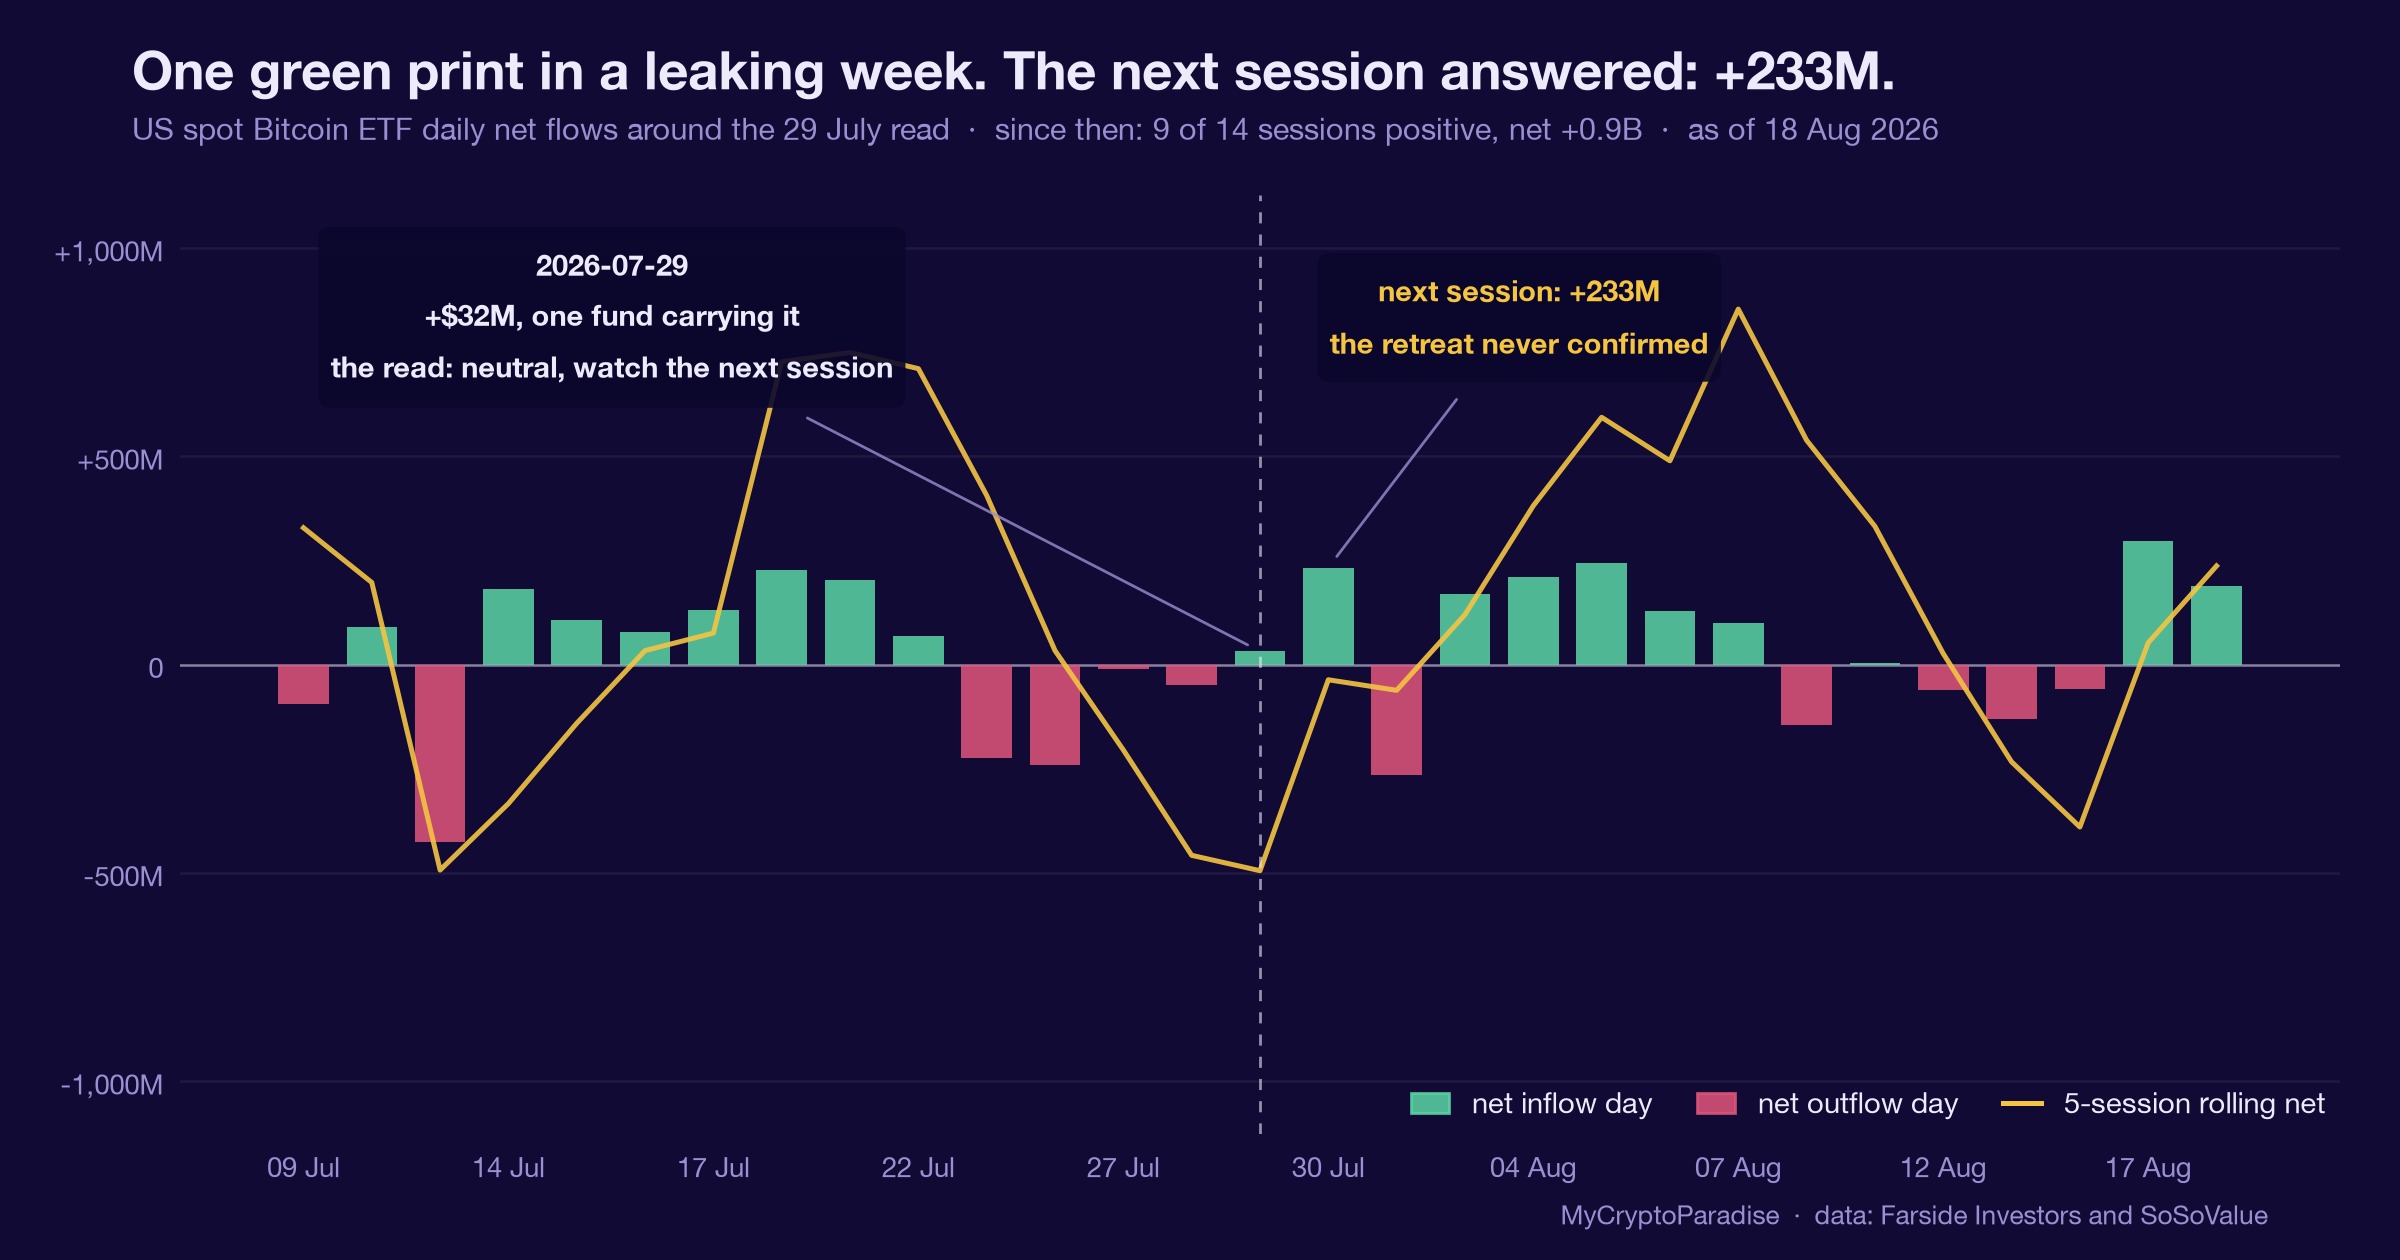
Net flows since the read: +$923M, with 13 of 22 sessions positive and the single biggest day at $298M. Cumulative flows moved from $51.4B to $52.3B. The tide grade sits at 53.
Price drifted higher over the same stretch while the flow gauge stayed near neutral. That is not the gauge failing; it is the gauge telling you the flow tape carried no edge either way, which it did not.
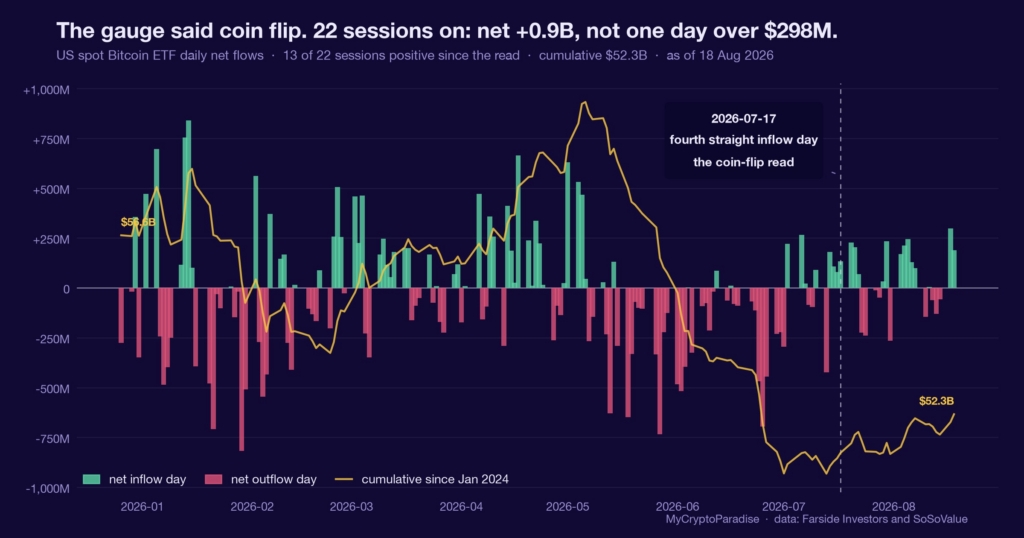
The banner above shows the whole tape: the daily bars, the cumulative curve, and the read marked where it happened.
Reading ETF flows yourself, step by step
- Separate streaks from magnitude. Four positive days at $130M is a different fact from one day at $900M.
- Rank the reading against its own history before reacting to it. A number without a distribution is a headline.
- Check whether price agrees with the flows. Green flows into soft spot is absorption, not momentum.
- Keep adoption theses on their own shelf. A decade-scale story cannot confirm or deny a weekly read.
- Write the kill condition down. For this read: the streak resetting to net outflows with the five-day reading flipping below zero.
You can watch the live streak and cumulative curve on our Bitcoin ETF flow tracker, cross-read leverage on the MCP Insights hub, and check the cluster map on the liquidation heatmap.
Act and invalidate
| Scenario | What confirms it | What kills it |
|---|---|---|
| Quiet accumulation continues | Steady positive days, cumulative curve grinding up | Streak resets to net outflows |
| Read turns constructive | Inflows accelerate while spot stops leaking | Flows accelerate but price keeps fading |
| Read turns negative | Five-day flow flips below zero and stays there | A single red day inside an intact streak |
Posture: a no-conviction tape favours patience over aggression. For most traders the highest-probability move on a 51 is no trade at all. New to reading fund flows? Start with MCP University.
Frequently asked questions
What are Bitcoin ETF net flows?
Each US spot Bitcoin ETF publishes daily creations and redemptions; the net flow is the sum across the complex, measuring real dollars entering or leaving. Cumulative net flows since launch in January 2024 stood at about $52.3B as of mid August 2026, per Farside Investors and SoSoValue data.
Do ETF inflow streaks predict Bitcoin’s price?
Not reliably on their own. At readings comparable to the 17 July 2026 streak, our history since April 2024 showed price resolving higher in roughly 11 of 22 cases, about 51%. That is a coin flip, and we published it as one rather than dressing it as a signal.
What does allocator absorption mean?
It is the pattern where net ETF buying continues while spot price stays soft, meaning the inflows are being absorbed rather than chased. It usually reads as patient positioning rather than momentum, and it argues for waiting rather than following the flows blindly.
Why not use the gold ETF comparison as a signal?
Because it is a multi-year adoption thesis, and nothing about the next ten sessions can confirm or refute it. It can be true while any given week goes either way. We grade the horizon we can falsify and keep decade-scale stories on their own shelf.
Where can I track Bitcoin ETF flows live?
Our Bitcoin ETF flow tracker shows the daily net flows, the current streak, the cumulative curve and the tide grade with its distribution. The leverage and positioning gauges sit alongside it in MCP Insights.
Crypto trading involves substantial risk and is not suitable for everyone. Nothing here is financial advice; it is education only. Never risk more than you can afford to lose.
The private Extras feed, where the flow streaks, tide grades and absorption reads update as each day’s data lands, is part of PRO Paradiser, the intelligence layer behind the ParadiseFamilyVIP strategies.



















Join the discussion
No comments yet. Pro Paradiser members, share how you are reading this.