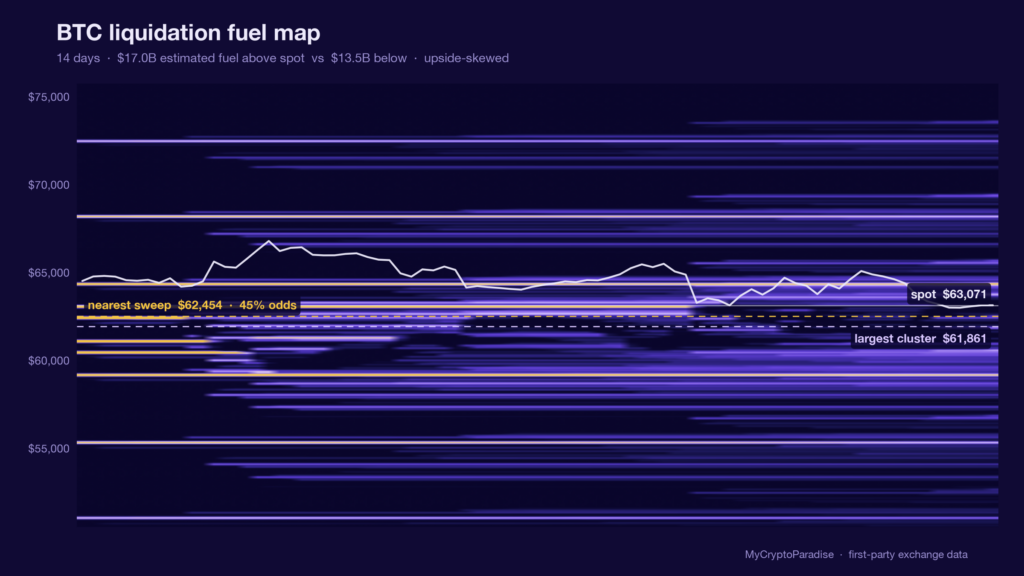
On 2026-08-01, an on-chain feed flagged BTC’s 24-hour liquidation heatmap as concentrated high-leverage liquidity. Our MCP Insights liquidation map quantifies it: at a spot of 63,070, roughly 1.26x more estimated fuel sits above price than below. The honest read is neutral, with an upside fuel lean.
Where the fuel actually sits
Per our MCP Insights liquidation data (first-party exchange data, estimated), 17.01 billion dollars of estimated liquidation fuel sits above spot against 13.49 billion dollars below. That is an upside-skewed imbalance: a push higher has more resting liquidity to feed on.
What the live grades say
Context matters more than the raw heatmap. Squeeze pressure reads 16 out of 100 (down 2): the crowded side is nowhere near being forced. Sweep odds on the nearest cluster sit at 43 out of 100. Flush odds on stretched leverage are 49 out of 100.
Sentiment is not helping the bulls either. The Fear and Greed reading is 27, squarely in fear, and estimated 90-day top risk holds at 48 out of 100. You can cross-read all of it against our live market insights. None of this forces a move; it maps where a move would find fuel if one starts.
Who hunts this, and why
A liquidation map is a target map. When one side stacks leverage, the incentive to run price into those stops is structural: resting liquidations are free liquidity for whoever can push into them. Right now the thicker target sits above 63,070, not below.
You can watch this live on our crypto liquidation heatmap, where the above-versus-below fuel split updates through the session. Weigh it against the crypto fear and greed index before you lean either way.
The scenario map
Base rates for this exact setup are not wired yet, so no historical frequency is claimed here. The primary read is neutral with an upside fuel lean: the heavier cluster above spot means an initiated push higher has more to feed on, but the low squeeze reading says nothing is primed.
Invalidation: a sustained break below 62,500, the recent range low, flips the below-spot cluster into the active magnet and kills the upside-fuel read.
Alternative: price coils under 63,070 with squeeze pressure this low, neither cluster gets swept, and BTC ranges rather than resolves. That is the outcome the current 16 out of 100 squeeze reading quietly favours.