In short
A liquidation map measures where leveraged positions would be force-closed if price runs, not where price is going. Per our MCP Insights liquidation data for 29 August 2026, BTC carries $24.3B of fuel stacked below spot against $7.1B above, a 3.4-to-1 skew with an imbalance reading of -55. We call this neutral, and explicitly not a sell signal: a lopsided map tells you which direction has more stops to hunt, not which way the tape breaks. We cannot grade this read yet, because it is today’s reading and nothing has resolved. We also refuse a base rate: our historical lake is not wired, and a frequency quoted from memory would be a fabrication. This piece shows you how to read a liquidation fuel map yourself, so the 3.4-to-1 number informs your risk instead of your direction.
A liquidation map shows pain, not direction
Every leveraged long has a price where the exchange closes it by force to protect the margin. Stack all those trigger prices together and you get a liquidation map: a picture of where forced selling and forced buying would cluster if spot moved.
The map is a record of positioning, not a prediction. It tells you where the stops are, which is not the same as knowing which way price will go to reach them.
A gauge that shows you where the fuel sits, without pretending to know the spark, is more honest than one that always points somewhere.
The 29 August map leans hard to the downside
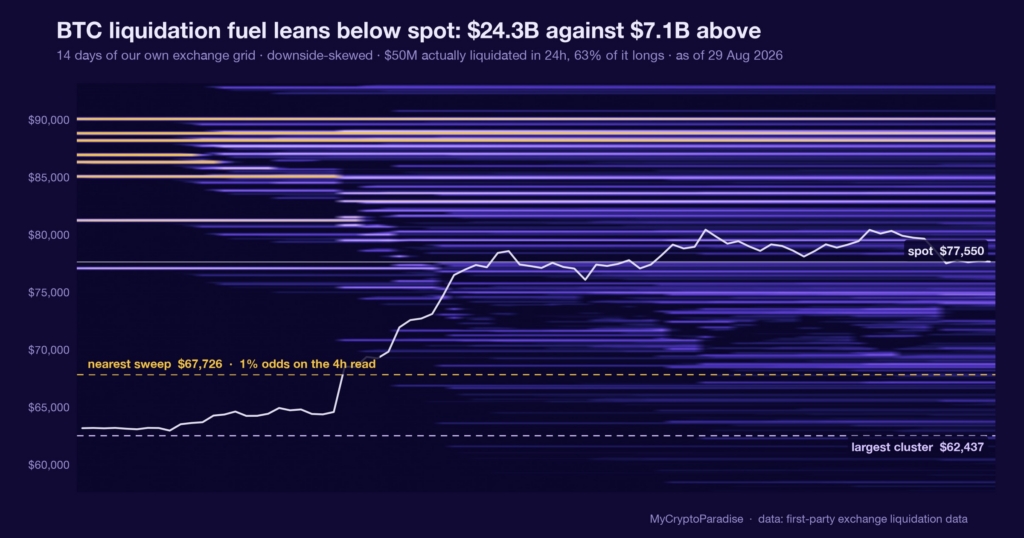
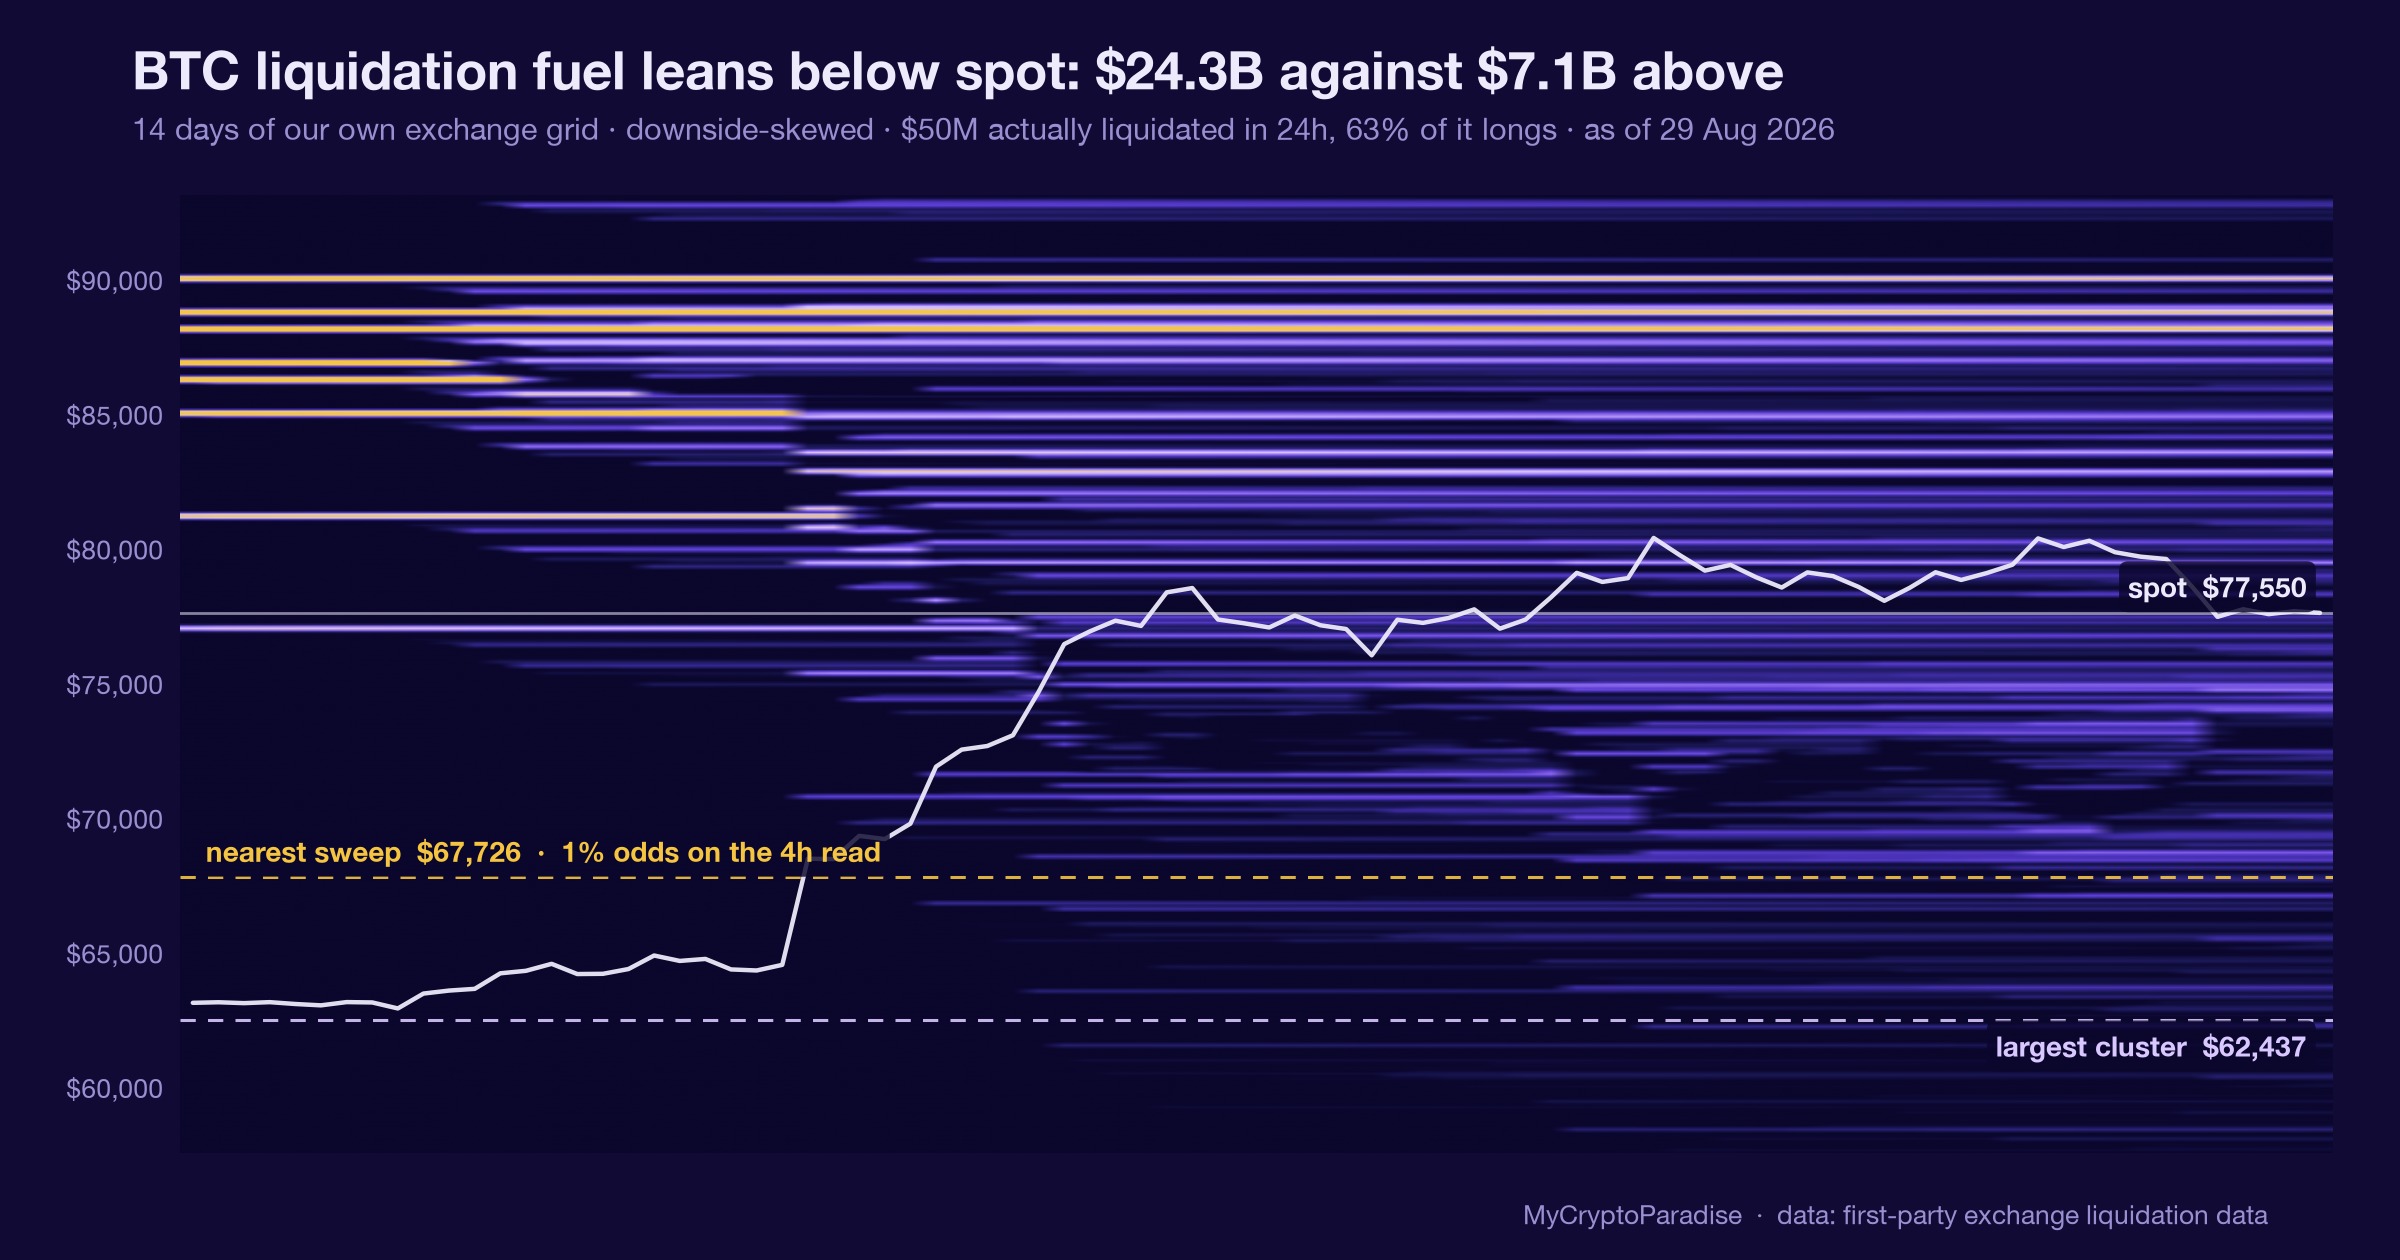
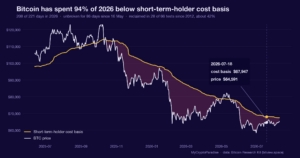
Per our MCP Insights liquidation data for 29 August 2026, BTC shows $24.3B of liquidation fuel stacked below spot against $7.1B above. That is a 3.4-to-1 skew, and the imbalance gauge reads -55, where negative means the heavier side sits underneath price.
Put differently: of roughly $31.4B in mapped fuel, about 77% sits below current spot and 23% above. The map is first-party, drawn from our own exchange liquidation series, not a re-narrated third-party screenshot.
A number with no source is decoration. This one is ours, and we will show its arithmetic before we show our opinion.
What is different here
The ParadiseTeam does not read a liquidation map as a price forecast. We publish the skew, the source and the imbalance number, then separate what the map measures from what it cannot know: positioning is not direction, and we size risk from the asymmetry rather than betting on which side burns first.
More fuel below does not mean price falls
The tempting misread is simple: heavier fuel below, so price drops to burn it. That inverts how liquidation clusters usually behave. Large pools of downside stops are exactly the liquidity a move can be engineered toward, but they are just as often defended.
A 3.4-to-1 skew tells you the pain is asymmetric, not that the outcome is decided. If spot grinds up instead, the thinner $7.1B above gives less resistance, and a squeeze there clears faster.
A read that only quotes the heavier side of the map is marketing. The lighter side is what sizes the surprise.
There is nothing to grade yet, and we say so
This is a same-day reading. No resolution has printed, so we publish no scorecard and claim no hit. When this map resolves, the follow-up will grade it plainly, including if the heavier side never burned.
We also decline a historical frequency. Our base-rate lake is not yet wired, and a rate recalled from memory would be invented, which is the one thing this stream will not do.
We do not know yet is a full verdict. It beats a confident number with nothing behind it.
Reading a liquidation fuel map yourself, step by step
- Open our crypto liquidation heatmap and find the current spot line, then note the clusters sitting above and below it.
- Add the fuel on each side into two totals, so you have one number below spot and one above.
- Divide the larger total by the smaller to get the skew ratio, the way $24.3B over $7.1B gives 3.4 to 1.
- Check the imbalance sign: negative means the heavier side sits below spot, positive means it sits above.
- Treat the ratio as a risk weight, not a direction, and mark the thin side as the faster path if price turns.
The step most people skip is the sign check: a big ratio feels bearish, but the imbalance number tells you which side is actually loaded, and that flips the meaning entirely.
Every number above is checkable against the live data. Start with the crypto liquidation heatmap, then cross-read the MCP Insights hub and the Crypto Fear and Greed Index.
Act and invalidate
| Scenario | What confirms it | What kills it |
|---|---|---|
| Downside fuel gets hunted | Spot breaks below, $24.3B pool lights up | Price holds and skew flattens |
| Upside squeeze instead | Thin $7.1B above clears fast | Spot stalls under resistance |
| Map just sits | Skew persists, no cluster burns | Fresh flow rebuilds either side |
Posture: Posture is defensive-to-neutral: the map argues for tighter risk near the heavier downside cluster, not for a short. For most, no-trade is the highest-probability play until a cluster actually starts to burn.
Frequently asked questions
Does more liquidation fuel below mean Bitcoin will fall?
No. A heavier pool below spot marks where forced selling would cluster if price drops, not a prediction that it will. On 29 August 2026 the 3.4-to-1 skew described risk asymmetry, and asymmetry is a weighting for your stops, not a directional call.
What does an imbalance reading of -55 mean?
The imbalance gauge sits on a scale where the sign shows which side holds more fuel. A negative figure of -55 means the heavier liquidation pool sits below current spot, matching the 3.4-to-1 skew reported on 29 August 2026 for BTC.
Where is the data in this reading from?
It comes from our own MCP Insights liquidation series, a first-party feed drawn from exchange data. We do not re-narrate third-party screenshots. The $24.3B, $7.1B and imbalance figures are ours, which is why we can show the arithmetic behind them.
Should I short Bitcoin based on this skew?
This is analysis, not a trade instruction, and it names no entry. The skew argues for defensive risk near the heavier cluster, not a position. For many readers the highest-probability action is no trade until a cluster actually begins to burn.
Why publish no base rate for this event?
Our historical base-rate lake is not yet wired, so we have no verified frequency of how such skews resolve. Quoting a rate from memory would be fabrication. When the lake is connected, these readings will carry real frequencies with error bars attached.
Crypto trading involves substantial risk and is not suitable for everyone. Nothing here is financial advice; it is education only. Never risk more than you can afford to lose.
The private Extras feed tracks the liquidation fuel map, skew ratio and imbalance gauge update intraday with their invalidation levels attached. It is part of PRO Paradiser, the intelligence layer behind the ParadiseFamilyVIP strategies.
















Join the discussion
No comments yet. Members, share how you are reading this.